Trafford Data Lab
Supporting decision-making in Trafford by revealing patterns in data through visualisation. We produce a variety of different types of output with a selection featured below. The headings link to more outputs of the same type and commonly used terms are in our glossary.
Featured:
Trafford Themes
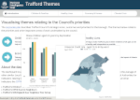
Interactive dashboard showing comparisons for a range of themed indicators relating to the work undertaken by Trafford Council, including those defined by the corporate priorities.
English Indices of Deprivation
Interactive apps and reports, static graphics and datasets based on the English Indices of Deprivation data released by the MHCLG.
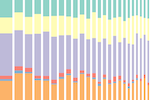
Trafford's population estimates
Analysis of Trafford's population change by age and components such as migration, deaths and births from mid-2023 to mid 2024.
Trafford wards and localities
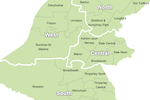
Map of Trafford showing the boundaries of the 21 wards and 4 localities.
Charticles, Data and Learning outputs are available from the main menu. The following sections contain interactive apps, collections of multiple outputs based on a theme, in-depth analysis reports and static graphics.
Apps
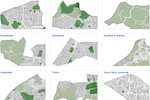
Ward Profiler
In-depth information focussing on each of Trafford's wards. Information is presented by theme as interactive maps and charts for easy comparison. The data and code for the visualisations can be downloaded.
Explore
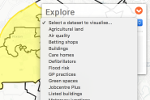
Discover the different geographic areas of Trafford and visualise all of our spatial datasets in one application. Use the geolocation and reachability tools to explore the borough.
Trafford Themes
Interactive dashboard showing comparisons for a range of themed indicators relating to the work undertaken by Trafford Council, including those defined by the corporate priorities.
Population Picker
Discover population figures for the different statistical and administrative geographies. Choose areas of interest and export the aggregated data. Population figures for Mid-2024
Flood Risk Monitor
Interactive map combining datasets from the Environment Agency and Ordnance Survey showing flood risk from watercourses in and around Trafford and the latest available water level readings.
Road casualties
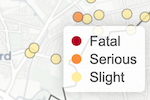
Application enabling users to explore GM reported road traffic accidents involving personal injury between 2010 and 2025.
Postcode Loader
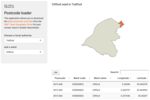
An R Shiny app allowing users to download the latest postcode centroids from the Office for National Statistics' Open Geography Portal API.
Postcoder
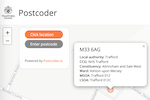
R Shiny application powered by Postcodes.io displaying administrative and statistical geographies for a given postcode, chosen either by entering manually or by selecting a point on the map.
Climate emergency slide pack
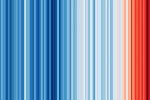
Over 300 local authorities have declared a "climate emergency". This tool, and our accompanying climate emergency open data companion, provides support by visualising open data relating to climate change.
Local Deprivation
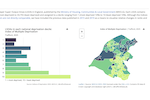
Interactive visualisations of the Indices of Deprivation 2025, 2019 and 2015 data released by the MHCLG for LSOAs across England by Local Authority District. Our Indices of Deprivation collection has further resources.
Choroplether
Create choropleth maps of your own data in Vega-Lite without having to write all the code yourself. Export the output as an image or embed it in a web page.
Plotter
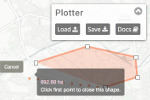
Create and edit map features in the form of lines, polygons, circles and markers and save the results. Load previously saved data and add to it, or use it in other software such as GIS.
Schools in Trafford
Find schools and colleges in Trafford by phase, type, Ofsted rating and other filters. Links to Ofsted reports, performance comparisons and the schools' websites are also provided.
Public Parks in Trafford
Discover the facilities available within the public parks in Trafford. Information regarding the various friends' groups is also available.
Collections
Trafford Wards
All our outputs and resources relating to Trafford's wards which came into force in May 2023. Profiles are available for each ward which include data from the 2021 census.
Census 2021
Visit our Census 2021 collections page for all our outputs relating to the census conducted by the Office for National Statistics in 2021 and published between 2022-2023.
COVID-19
Visit our COVID-19 collections page for all our outputs and resources relating to the coronavirus pandemic.
English Indices of Deprivation
Interactive apps and reports, static graphics and datasets based on the English Indices of Deprivation data released by the MHCLG.
Reports
Claimant Count and Universal Credit in Trafford
Analysis of claimant count and Universal Credit claims in Trafford over time, including area and age-group breakdowns. This report is updated on a regular basis using data from Nomis.
Trafford's population projections
Analysis of Trafford's population projections based on 2022 including growth to 2032 and splits by age.
Trafford's population estimates
Analysis of Trafford's population change by age and components such as migration, deaths and births from mid-2023 to mid 2024.
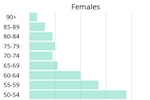
Mid-Year population for Trafford’s wards
Analysis of Trafford's wards population figures including population change and population pyramids for each ward from the Mid year population estimates comparing 2023 to 2024.
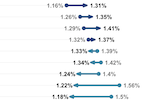
2021 Ethnicity, Identity, Language and Religion
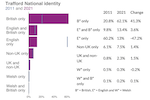
This report analyses the data published regarding the ethnic group, national identity, language, and religion of residents from the 2021 census and compares it to similar data from the census in 2011.
Trafford's PIP claims
Analysis of Personal Independence Payment (PIP) claim figures in Trafford by disability or disorder, age and MSOA in January 2025, as well as changes from January 2020.
Graphics
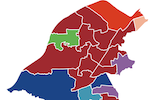
Trafford wards and localities
Map of Trafford showing the boundaries of the 21 wards and 4 localities.
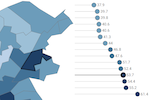
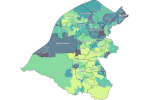
Resident population of Trafford
Mid-year 2022 resident population estimates for Trafford visualised by electoral ward.
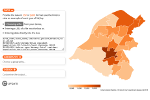
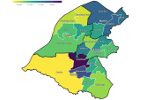
Index of Multiple Deprivation 2025 for Trafford
Visualising the data released by the MHCLG for LSOAs in Trafford. The 2019 version is also available. Our Indices of Deprivation collection has further resources.
2011 Output Area Classification
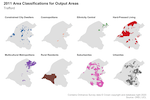
The Output Area Classification is an open source geodemographic classification using the 2011 Census to group the UK's Output Areas. Explore the pen portraits and radial plots for more information.