Source: 2025 Indices of Deprivation, Ministry of Housing, Communities & Local Government.
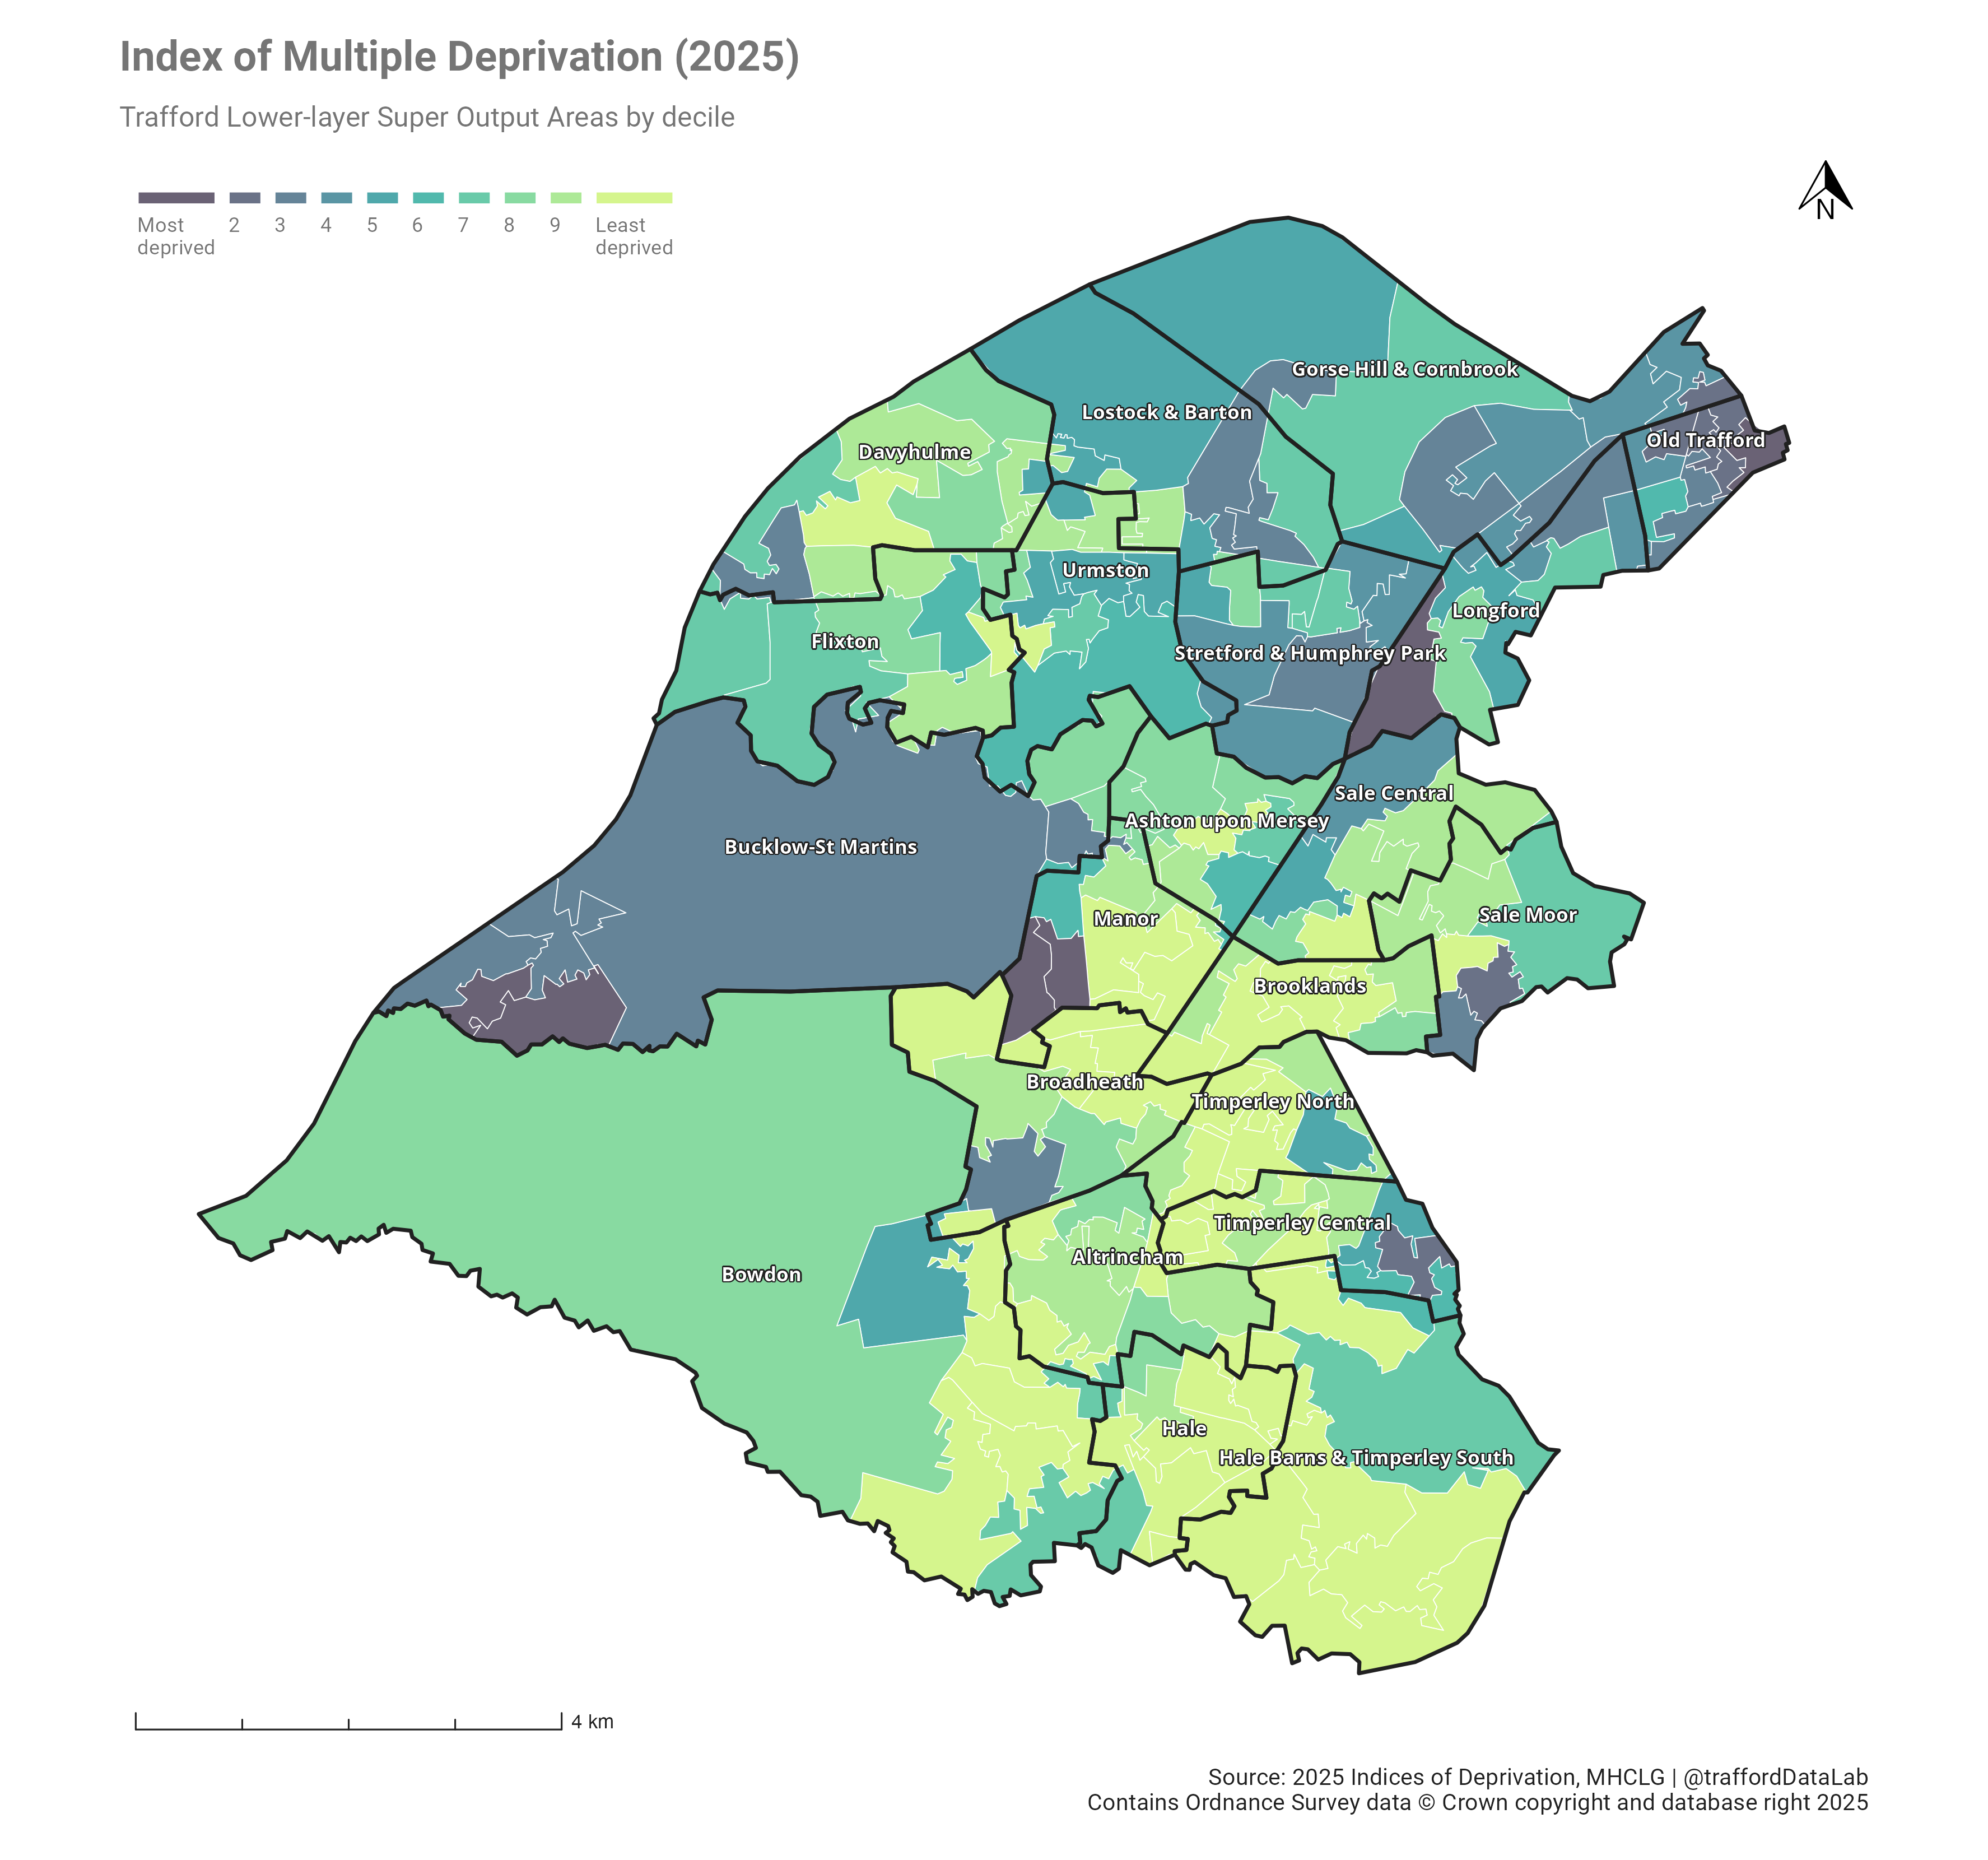
The Indices of Deprivation measure relative levels of deprivation in 33,755 Lower-layer Super Output Areas (LSOAs) in England based on 37 indicators across 7 domains: "Income Deprivation", "Employment Deprivation", "Education, Skills & Training Deprivation", "Health Deprivation and Disability", "Crime", "Barriers to Housing and Services" and "Living Environment Deprivation". The Index of Multiple Deprivation (IMD) is an overall measure of relative deprivation based on the 7 domains. Each LSOA contains approximately 1,500 residents or 650 households. They are ranked from 1 (most deprived) to 33,755 (least deprived) and assigned to a decile ranging from 1 (most deprived 10%) to 10 (least deprived 10%). Trafford contains some of most and least deprived areas in the country. The 6 most deprived areas are located in the ward of Bucklow-St Martins in the West of the borough, in Longford and Old Trafford wards in the North, and in Manor ward in the Central locality. The 36 least deprived areas are located mainly in the Southern and Central areas of Trafford. It should be noted that Electoral Ward boundaries and LSOA boundaries do not always perfectly align and so it is impossible to aggregate from LSOA to ward exactly.