English Indices of Deprivation
The English indices of deprivation are accredited official statistics on relative levels of deprivation in England, published by the Ministry of Housing, Communities & Local Government (MHCLG).
The English indices of deprivation 2025 were published by the MHCLG on . All resources on this page have been updated with the 2025 data.
The Indices measure relative levels of deprivation in 33,755 Lower-layer Super Output Areas (LSOA) in England. Each LSOA contains approximately 1,500 residents or 650 households. They are ranked from 1 (most deprived) to 33,755 (least deprived) and assigned to a decile ranging from 1 (most deprived 10%) to 10 (least deprived 10%). Local authorities in England are also ranked from 1 to 296 based on a population weighted average rank or score of the LSOA data.
Relative deprivation is measured using 55 indicators which are grouped across seven different domains: Income; Employment; Education, skills & training; Health & disability; Crime; Barriers to housing & services; Living environment. Each domain is combined and weighted to create the Index of Multiple Deprivation (IMD), the official measure of deprivation in England.
LSOA and Local Authority District resources across England
Local Deprivation app
Interactive visualisations of the Indices of Deprivation 2025, 2019 and 2015 data releases for Lower-layer Super Output Areas (LSOA) across England. The LSOAs are visualised geographically and within a chart via the Local Authority Districts they belong to.
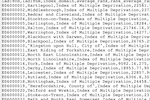
LSOA data 2025
Indices of Deprivation 2025 data at Lower-layer Super Output Area (LSOA) level across England. The metadata page contains links to the source data and more information.
Local Authority District data 2025
Indices of Deprivation 2025 data at Local Authority District level across England. The metadata page contains links to the source data and more information.
Local Authority District resources for Trafford

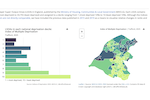
Relative deprivation in Trafford Report
Report visualising and analysing the Indices of Deprivation data for 2025 and the relative changes from 2019 for Trafford in comparison to other statistically similar Local Authorities and those within Greater Manchester.
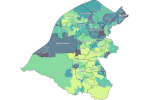
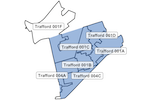
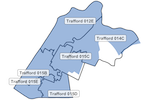
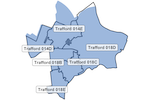
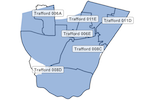
Index of Multiple Deprivation 2025 for Trafford
Static graphic visualising the overall Index of Multiple Deprivation (IMD) for Lower-layer Super Output Areas (LSOA) in Trafford. The previous version based on the Index of Multiple Deprivation 2019 is also available.
Electoral Ward resources for Trafford
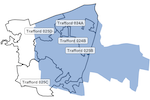
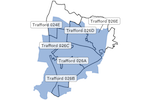
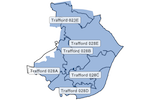
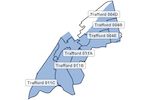
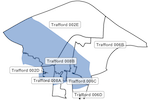
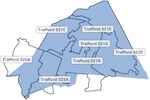
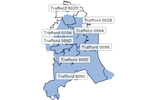
Electoral Ward boundaries and LSOA boundaries do not always perfectly align and so it is impossible to aggregate from LSOA to ward exactly. Instead a ‘best-fit’ methodology is used by the Office for National Statistics (ONS) to assign LSOAs to the most appropriate ward.
Electoral Ward data 2025
Population weighted average scores of the best-fit LSOAs assigned to each ward in Trafford for each domain and index of the Indices of Deprivation 2025 and the resulting relative ranks, where 1 is the most deprived and 21 is the least deprived.
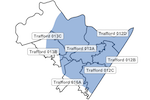
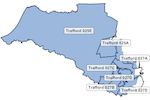
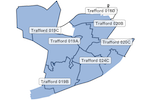
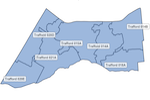
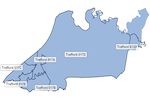
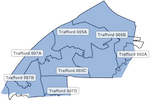
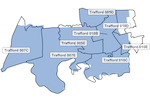
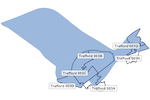
The following reports present the Indices of Deprivation 2025 data for each of the 21 wards in Trafford, based on the best-fit LSOAs. The rankings mentioned below, where 1 is the most deprived and 21 is the least deprived, are based on the Index of Multiple Deprivation (IMD) 2025.
Altrincham
 IMD 2025 Rank:
19 out of 21.
(3rd least deprived).
Ashton upon Mersey
 IMD 2025 Rank:
13 out of 21.
Bowdon
 IMD 2025 Rank:
15 out of 21.
Broadheath
 IMD 2025 Rank:
16 out of 21.
Brooklands
 IMD 2025 Rank:
21 out of 21.
(Least deprived).
Bucklow-St Martins
 IMD 2025 Rank:
1 out of 21.
(Most deprived).
Davyhulme
 IMD 2025 Rank:
12 out of 21.
Flixton
 IMD 2025 Rank:
14 out of 21.
Gorse Hill & Cornbrook
 IMD 2025 Rank:
3 out of 21.
(3rd most deprived).
Hale
 IMD 2025 Rank:
18 out of 21.
Hale Barns & Timperley South
 IMD 2025 Rank:
20 out of 21.
(2nd least deprived).
Longford
 IMD 2025 Rank:
4 out of 21.
Lostock & Barton
 IMD 2025 Rank:
7 out of 21.
Manor
 IMD 2025 Rank:
5 out of 21.
Old Trafford
 IMD 2025 Rank:
2 out of 21
(2nd most deprived).
Sale Central
 IMD 2025 Rank:
11 out of 21.
Sale Moor
 IMD 2025 Rank:
8 out of 21.
Stretford & Humphrey Park
 IMD 2025 Rank:
6 out of 21.
Timperley Central
 IMD 2025 Rank:
10 out of 21.
Timperley North
 IMD 2025 Rank:
17 out of 21.
Urmston
 IMD 2025 Rank:
9 out of 21.