Housing is becoming less affordable in Trafford
In 2010 the median house price in Trafford was £180,000 increasing to £325,000 in 2021 which represents an 80.6% rise. In contrast the median gross annual workplace-based earnings in Trafford has increased just 21% during the same period from £26,092 in 2010 to £31,567 in 2021.
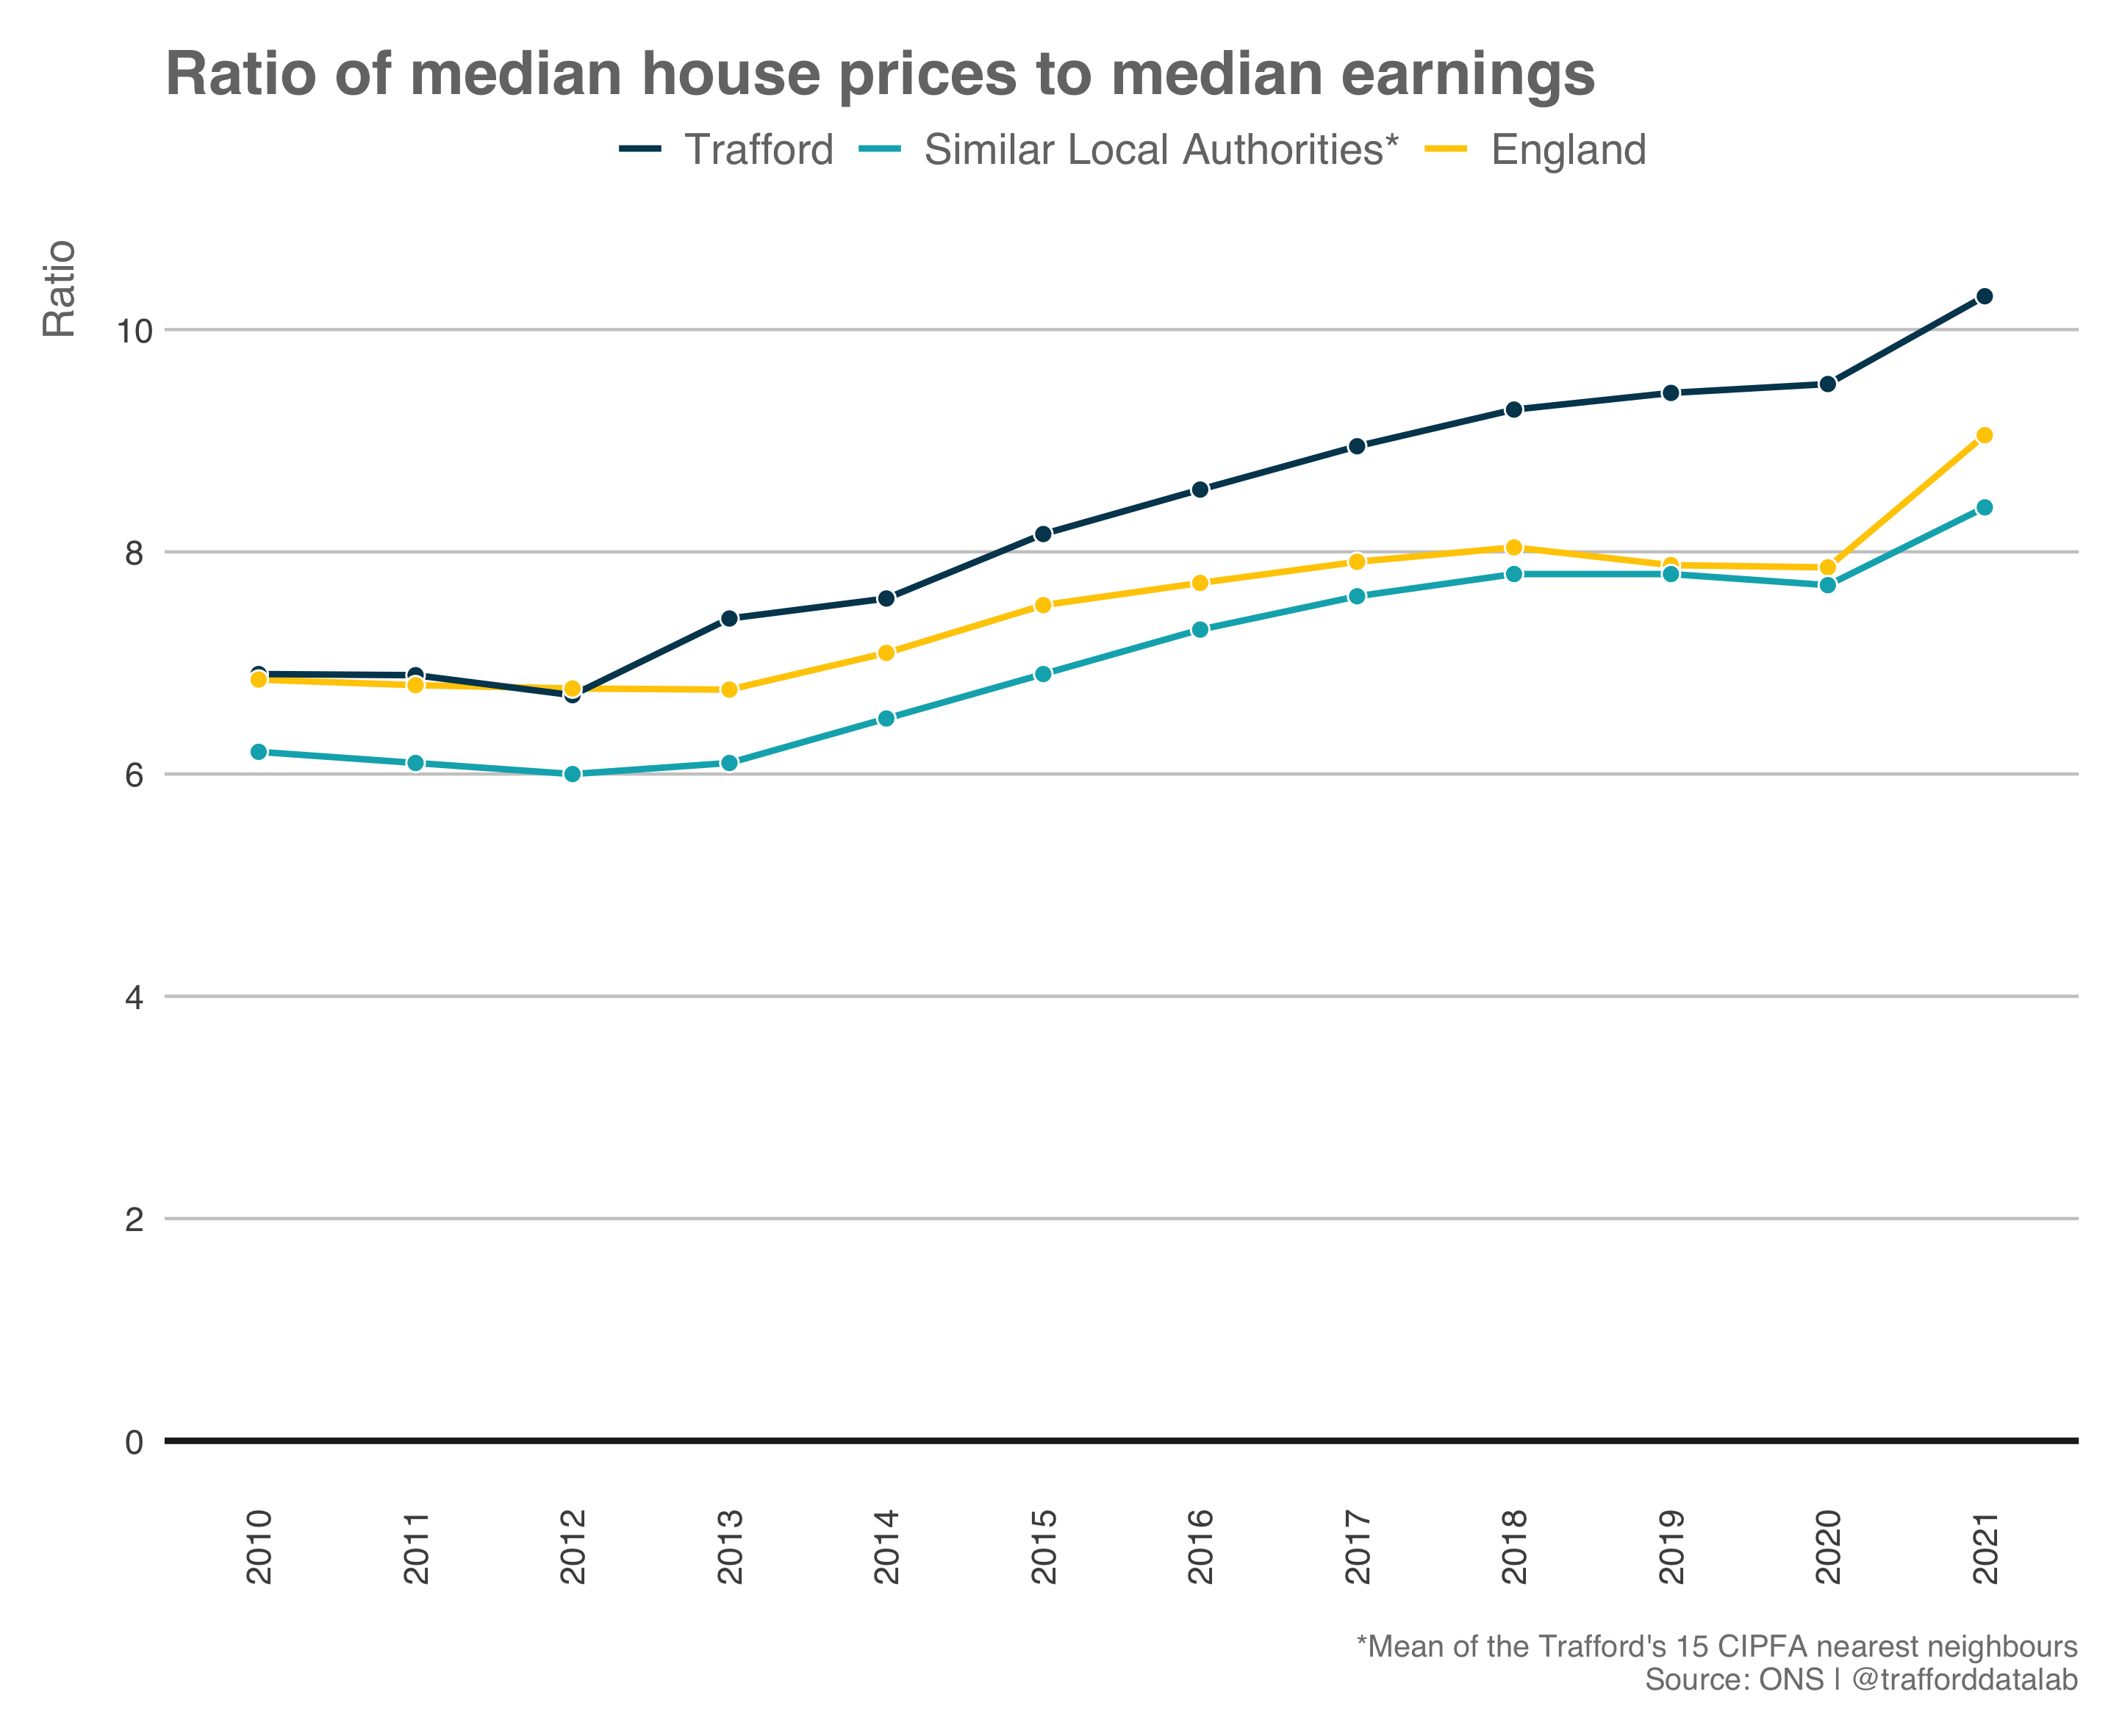
Affordability ratios are calculated by dividing median house prices by median gross annual workplace-based earnings. Higher affordability ratios tend to indicate less affordable housing. Since 2013 Trafford has maintained a higher affordability ratio when compared to England and the average of similar local authorities. Trafford's affordability ratio for 2021 was 10.3 which means that the median house price is more than ten times the median annual earnings for the borough. That was more than one point higher than England's ratio at 9.05, and more than two points higher than the average of similar local authorities which had a ratio of 8.
Housing has become less affordable over the years. A more notable decrease in housing affordability occurred when the effects of the COVID-19 pandemic brought a steep rise in the median house price which also caused a steep rise in the affordability ratio from 9.5 in 2020 to 10.3 in 2021 in Trafford. This is part of a national trend where England’s affordability ratio increased from 7.9 in 2020 to 9.1 in 2021.