Source: 2015 Indices of Deprivation, Ministry of Housing, Communities & Local Government.
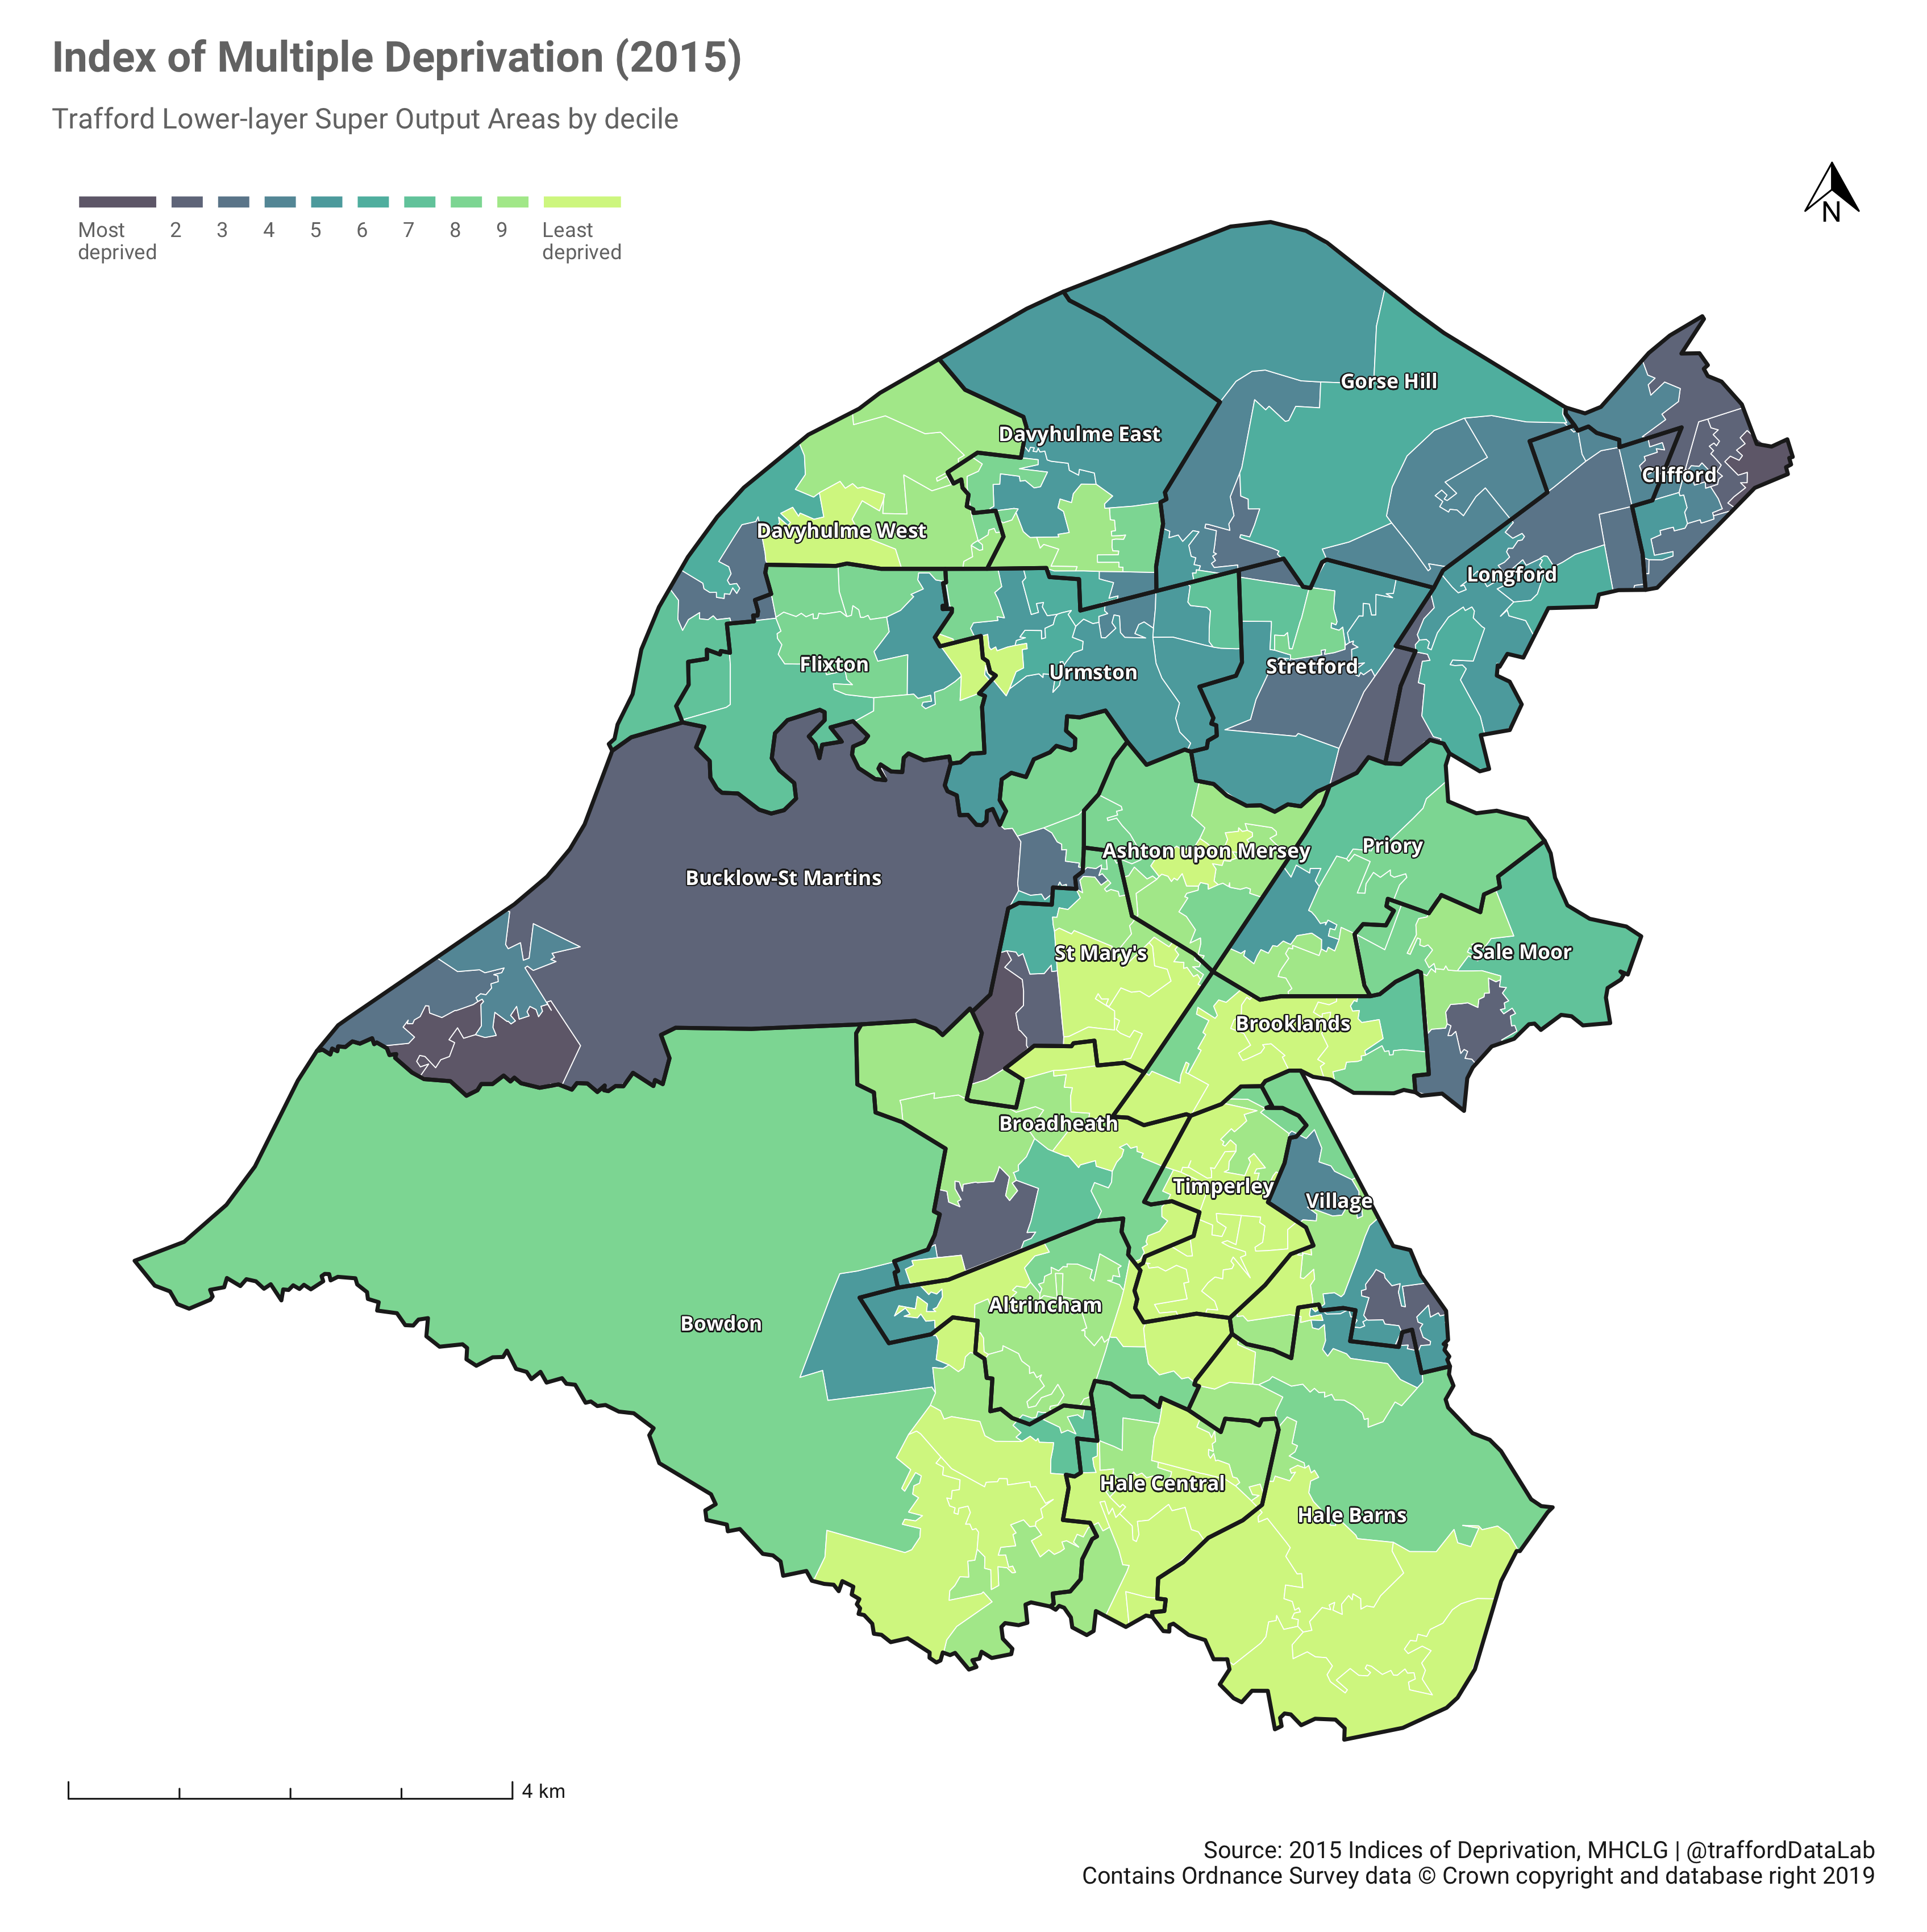
The Indices of Deprivation measure relative levels of deprivation in 32,844 Lower-layer Super Output Areas (LSOAs) in England based on 39 indicators. Each LSOA contains approximately 1,500 residents or 650 households. They are ranked from 1 (most deprived) to 32,844 (least deprived) and assigned to a decile ranging from 1 (most deprived 10%) to 10 (least deprived 10%). The Index of Multiple Deprivation (IMD) is an overall measure of relative deprivation. Trafford contains some of most and least deprived areas in the country. The most deprived areas are primarily located in and around the ward of Bucklow-St Martins in the West of the borough, and in the North, particularly in Clifford ward. The least deprived areas are located mainly in the Southern and Central areas of Trafford, particularly in and around the wards of Timperley and Brooklands. It should be noted that Electoral Ward boundaries and LSOA boundaries do not always perfectly align and so it is impossible to aggregate from LSOA to ward exactly.